IPO News Big Cap News Small Cap News Mutual Funds Market News Traders Chat Room

Technical Analysis

Charts

Price Fields

Support/Resistance

Pivots

Trend Lines

 Moving Averages

Fibonacci Numbers 

Gann Lines

Chart Patterns

Head and Shoulders

Symmetrical Triangles

Flags and Pennants

Wedges

Channel Formation

Cup and Handle

Double/Triple Tops

Indicators

Stochastics

Relative Strength Index

Commodity Channel Index

Bollinger Bands

MACD

Herrick Payoff Index

Volume

ADX

Sierra Charts

Stochastics

INVESTOR INFO

Investment Systems

Investment Training

Wave59 Software

Futures Trading

Forex  Trading

Best Day Trading

Mutual Fund Traders

Swing Trading

ArbTrac Investments

Get Folio Investments

Dow Investments

Candlestick Shop

Stocksystem

 Expert Stock Picks!

Winning Stocks

Trading Solutions 

Safe Money Report

Day Traders Chat

Trading Services


Double/Triple Tops


Double Top

Double tops are identified as two peaks failing to break the same level of resistance. The target is measured vertically from the highest point to the bottom of the trough between the two peeks. It is then projected down from the break of the neckline. 
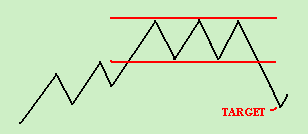

Triple Top

Triple tops are identified as three peeks failing to break the same level of resistance. The target is measured vertically from the highest point to the bottom of the trough between the three peeks. It is then projected down from the break of the neckline. 

 For obvious reasons this is often called an "M-top"  The market is failing twice at a resistance and is reversing then sharply. A break of the support would indicate further losses towards the target that can be evaluated through the following procedure. The vertical width of the "M" (price difference) is projected downwards from the breakpoint of the support. The opposite of this reversal formation occurs on a bottom - W-bottom


StoSGemstones Jewelry

StoSFlowers

StoSgifts

StoSOutdoors

 StoSNotebook Computers

StoSWealth.com